Mark Dominus (陶敏修)
mjd@plover.com
I have another blog that doesn't suck.
Archive:
| 2023 | JF |
| 2022: | JFMAMJ |
| JASOND | |
| 2021: | JFM |
| 2020: | JFMAMJ |
| JASOND | |
| 2019: | JFMAMJ |
| JASOND | |
| 2018: | JFMAMJ |
| JASOND | |
| 2017: | ND |
Comments disabled
Here are the volume graduations on the tank of my Water-Pik:
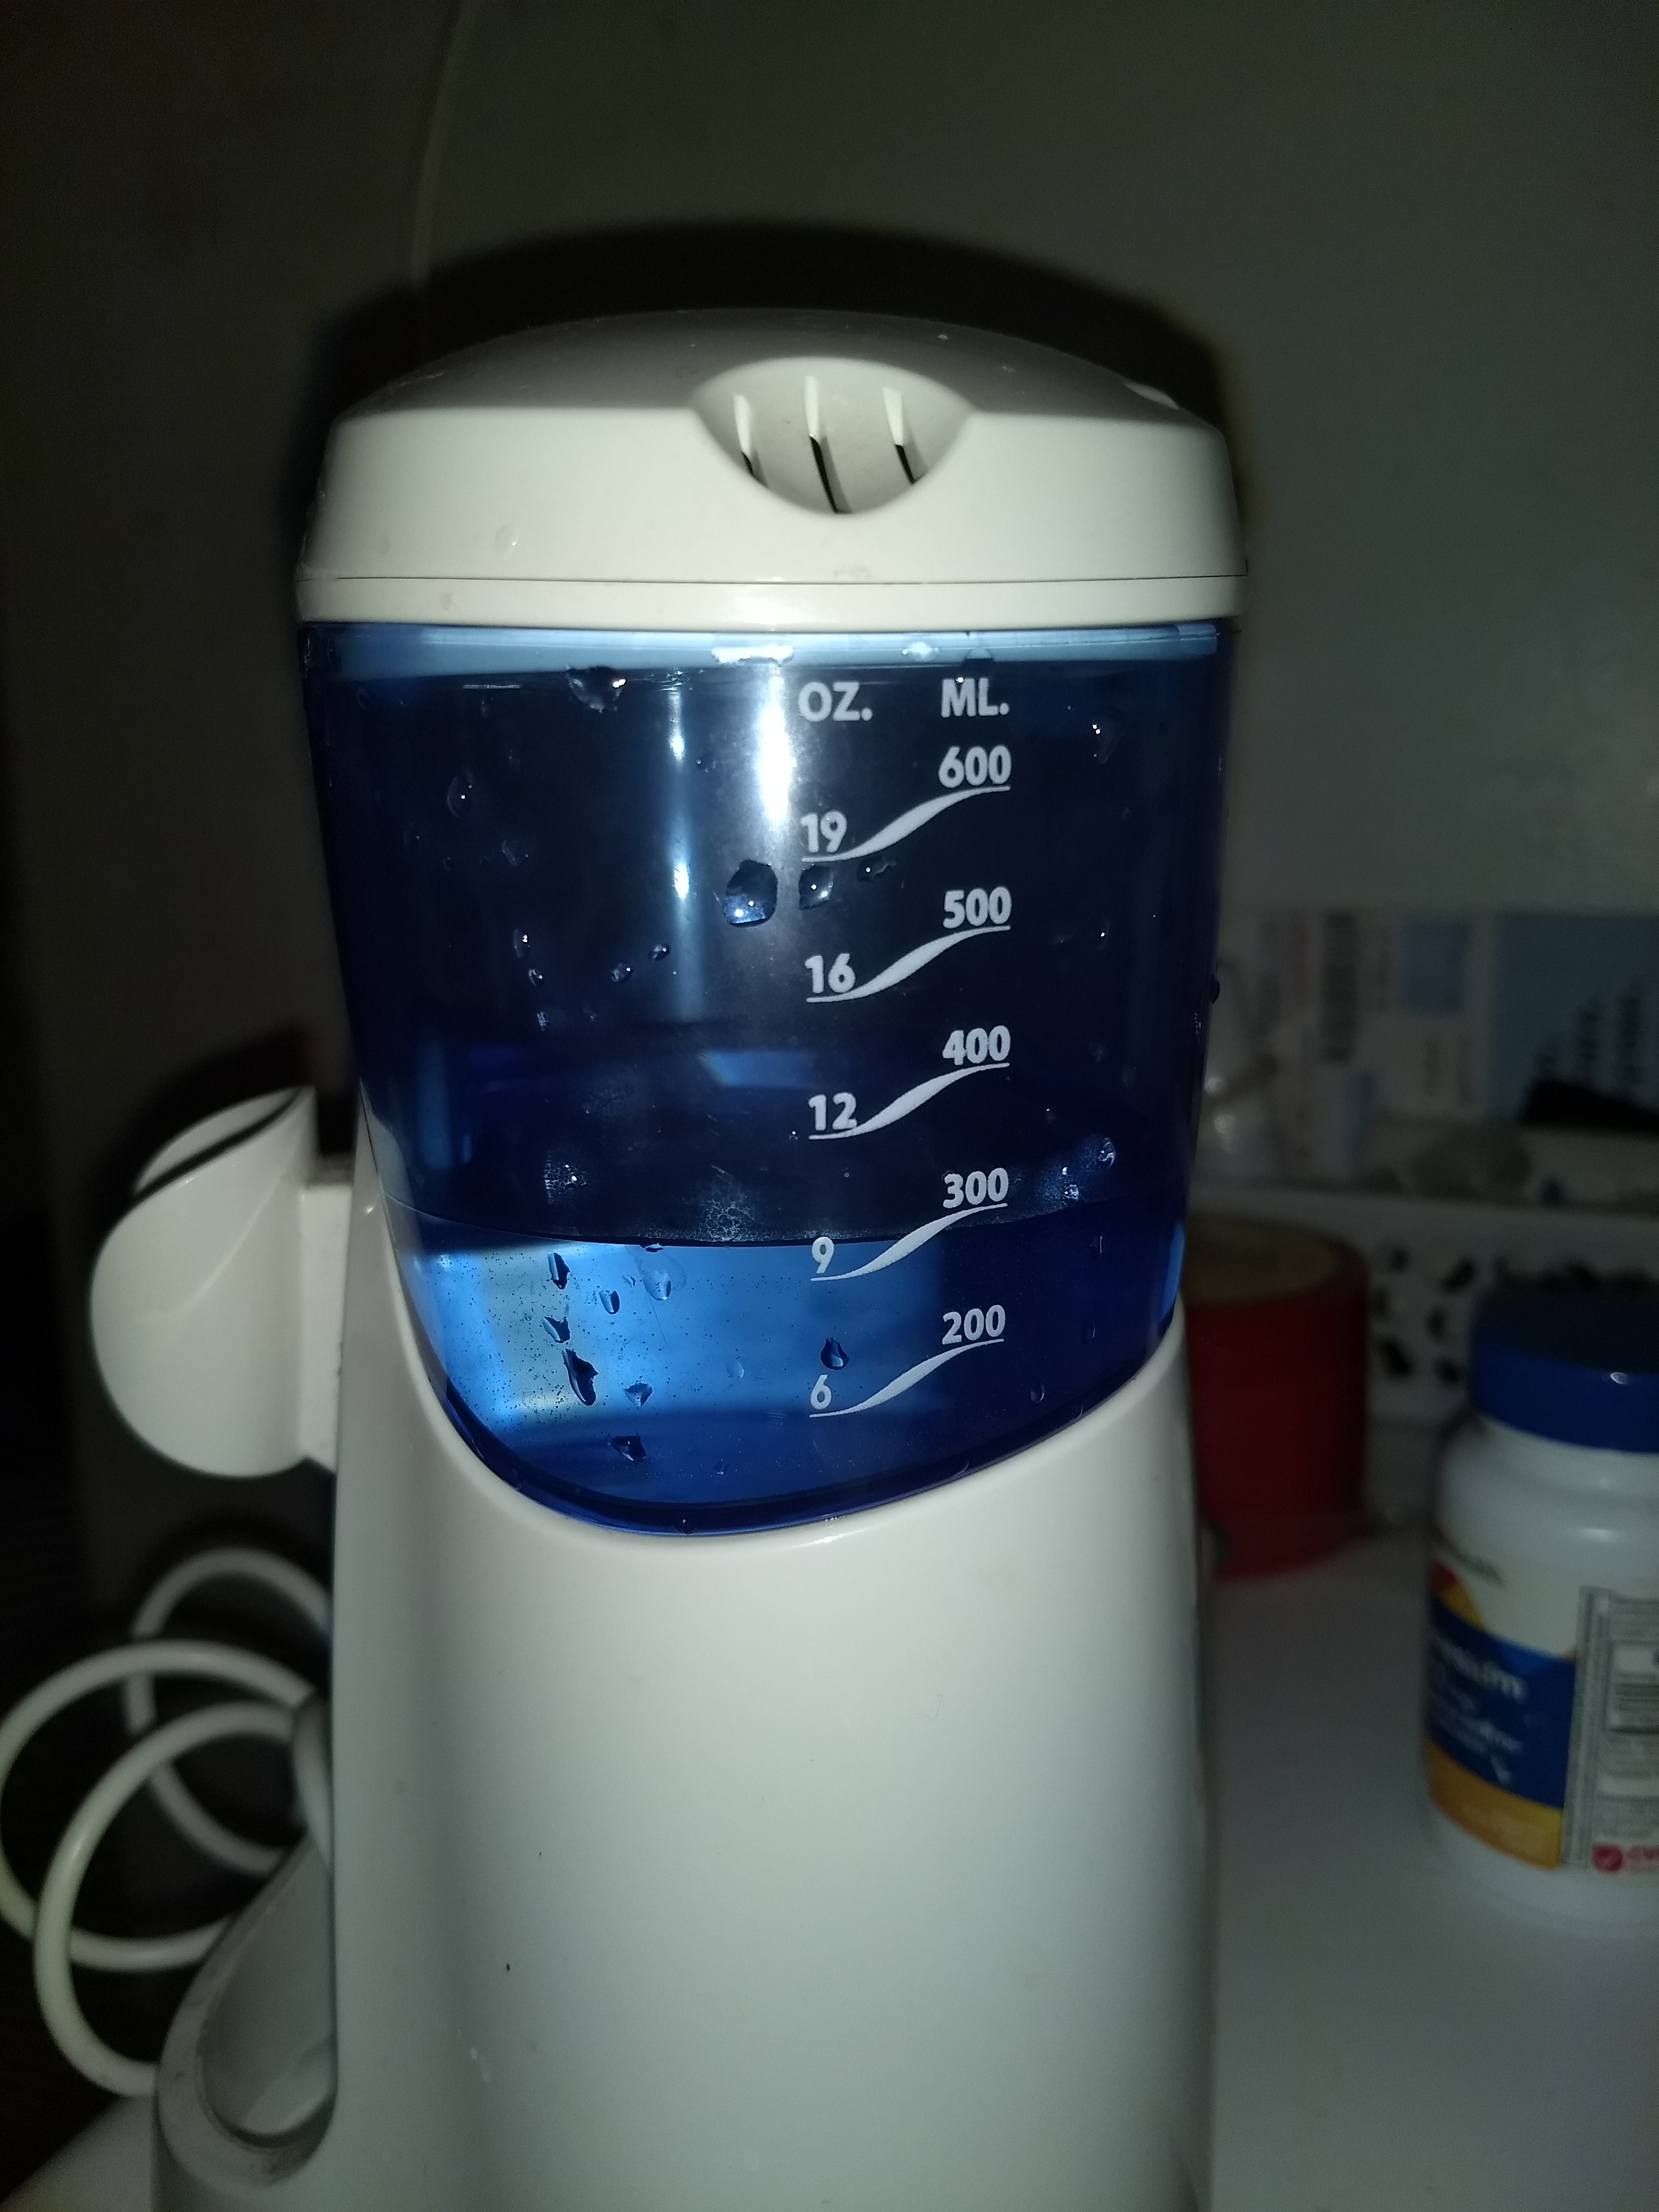
Now what is going on here?
I measured the heights of the marks in pixels in the photo:
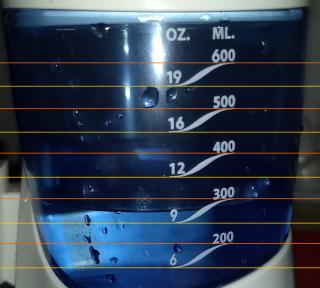
| OZ. | ML. | pixels |
| 600 | 1094 | |
| 19 | 963 | |
| 500 | 838 | |
| 16 | 707 | |
| 400 | 590 | |
| 12 | 456 | |
| 300 | 335 | |
| 9 | 199 | |
| 200 | 86 | |
| 6 | -50 |
Then I ran linear regressions.
For the milliliters values, the line is $$\text{px} = 2.59\text{ ml } -419$$ with a correlation of 99.9988%. Fair enough.
For the ounces values, the line is $$\text{px} = 76.5\text{ oz } -495$$ with a 99.86% correlation. That slope of !!76.5\frac{\text{px}}{\text{oz}}!! is exactly the same as the !!2.59\frac{\text{px}}{\text{ml}}!! slope in the previous line. If we correct the two suspicious ounce numbers from 16 and 19 to 15 and 18, the correlation goes up to 99.9988% but the slope increases to !!84.5\frac{\text{px}}{\text{oz}}!!.
I guess the next step would be to measure the amounts but
Addendum: That's the point at which I lost interest and broke off mid-sentence. It's now about 24 hours later and I've decided to publish what I have.
Enjoy!